Use Google Analytics to See How People Find You
- 15 March 2018
- ByBig Cartel
- 2 min read

Maybe you're just starting an online shop, or perhaps you're a seasoned pro. No matter the situation, you should always be focused on creating awareness around your brand and driving traffic to your work.
But what should you focus on? Do you up your social media game? Do you work on your search engine optimization? Do you try to get featured on blogs? And how do you even know if what you're doing is working?

This is where analytics comes in - data can help you understand how people get to you and what they do when they get there. You can use it to see what happens (or doesn't) when you make certain changes, like running ads for your new product or trying out a different social network.
To gather all that data, you'll want to use a tool like Google Analytics. Setup is painless, and it tracks all kinds of information for you. Start here to build your toolkit, then you'll be ready to see what it all means for your business.
Once you're gathering data, it'll be easier to understand how people get to your site, where they're coming from, and even what kind of device they're using. After you get a grasp on your traffic, then you can focus on making it work for you. You'll make the most of any traffic coming your way by spending more time on the social networks that drive a lot of clicks, turning more browsers into shoppers by offering discounts during peak traffic times, and optimizing your images and design for mobile devices.
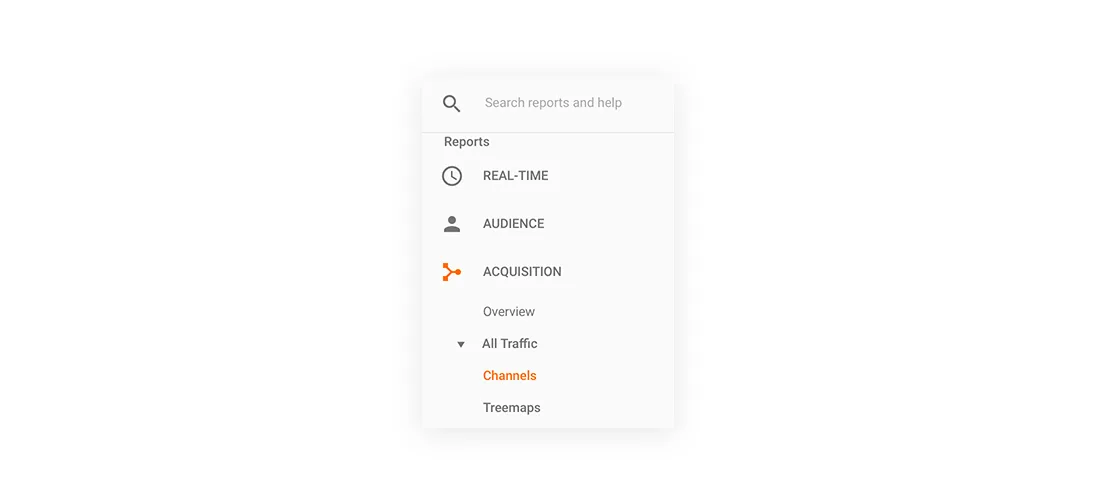
To wrap your head around these numbers, you'll mostly use an area called Acquisition. Thankfully, that's also right where you're going to look in the Google Analytics interface - in the left sidebar, select Acquisition, All Traffic, then Channels. Now let's dig in.
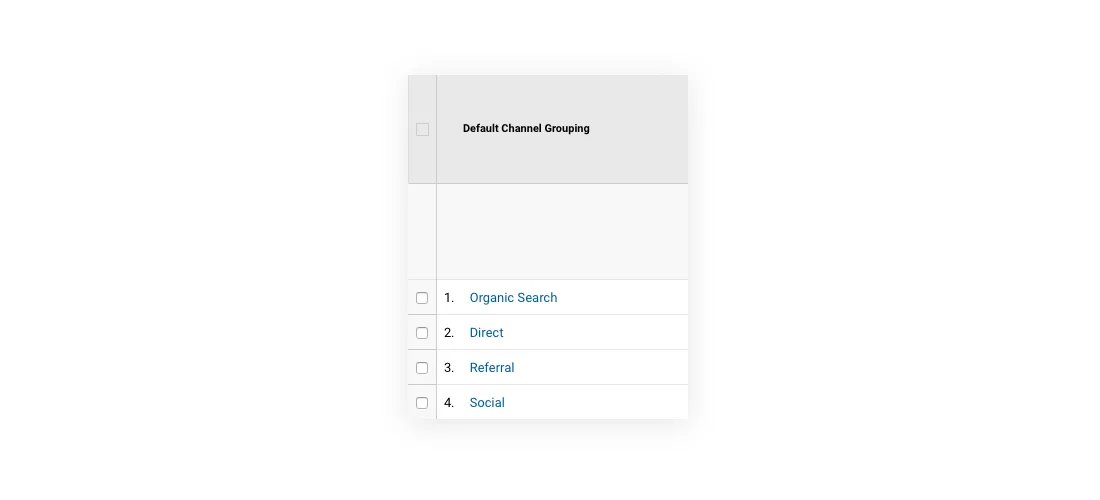
The Channels menu groups all your site's traffic together. Search is everyone who arrives via a search engine, whether it's Google, Yahoo, or one of those other search engines. (It's probably Google.) Referral is traffic that comes directly from a known source, usually a link on another website. Direct is anyone who typed in your address or got there from a website that didn't share their source. Social is, yep, social media.
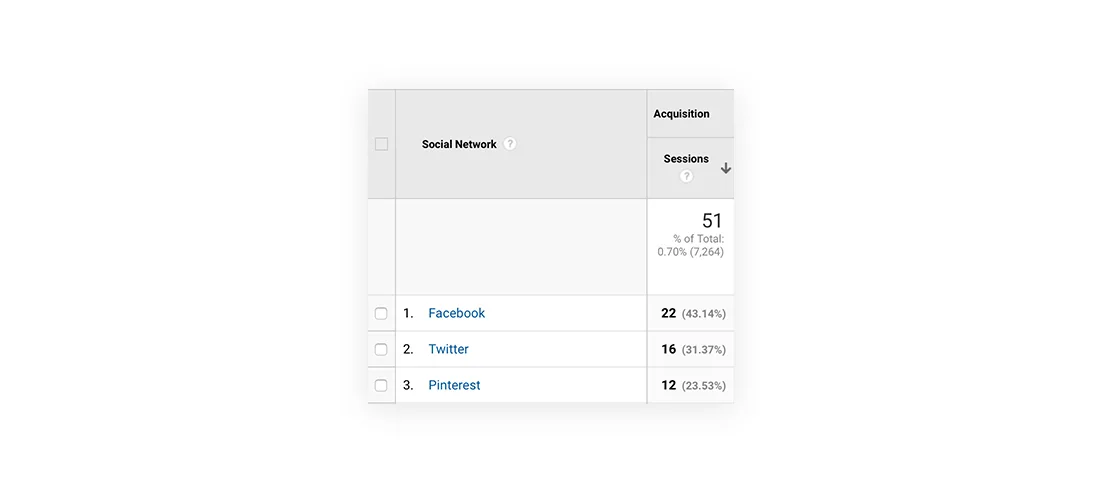
You can click on the channel names to get more details. Because of the ways each channel differs, you'll get unique information from each one. Search takes you to the search phrases that led to your site - although most of them will come back as (not provided) or (not set) due to web browser privacy settings. Direct tells you what page the visitors started on. Referral takes you to a list of websites (or other sources) that linked to you.
If you're looking to make a direct impact on your traffic and measure its results, social media is the channel you have the most control over, so consider starting there rather than trying to tackle Google or SEO. (If you're ready to get started on SEO, we've got you covered.)
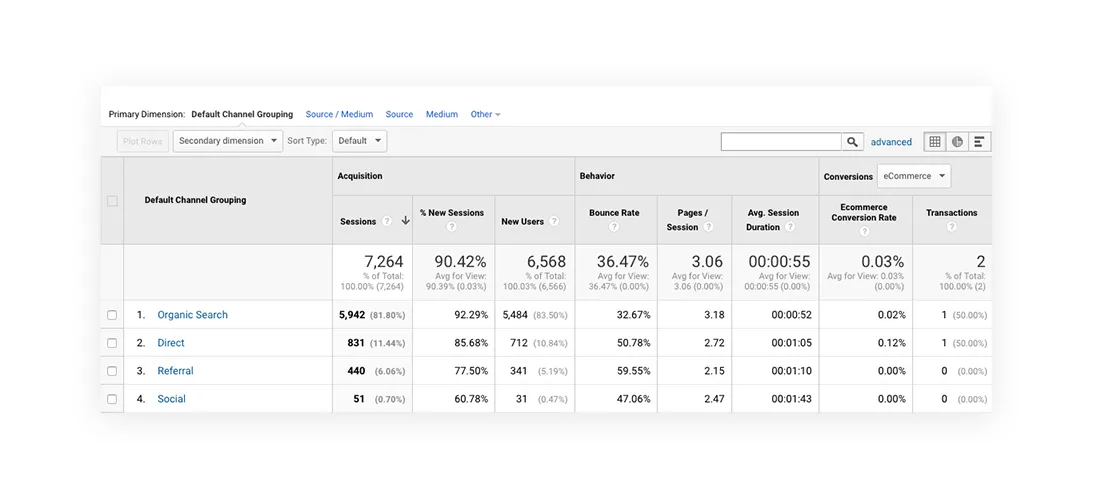
The table has a lot of numbers, but there are three main statistics to concentrate on: Sessions (how many people came to your site), Transactions (how many times did they buy things), and Pages per Session (how many things did they look at while they were there). All of these are nice and the bigger the better.
It's hard to compete with Transactions - does anything beat a shopper placing an order? But Sessions are great, too, because more people coming to your site equals more people who know about your work. Pages per Session is interesting because it gives you a chance to try to figure out a visitor's intent.
If you have a channel with high Sessions and high Transactions, but low Pages per Session, those could be people who know what they want, know you have it, and get right to it. That's great!
If you have a channel with relatively high Pages per Session, it tells you that the people coming to you that way are looking around your site, getting to know you, wanting to know more. If you're not seeing the Transactions to match, what could you consider changing to incentivize a purchase? Maybe try offering a discount code or bundles of your most popular items.
If you're not happy with your search traffic, take a little time to read through Google's SEO Starter Guide. If you want to get more out of your social networks, click Social to see how each is performing, and choose one to perk up. Once you see where your traffic is coming from, you can decide what to tweak.
Whether you change your social media strategy, start sending out a newsletter, or try to get more links, consider making one change at a time. Then you can watch how your numbers change over the next week or two, and use what you learn to inform your next decision.
A quick side note: You can choose a time frame to view your stats in Google Analytics. Most pages in Google Analytics have a date picker drop down in the top right. It generally defaults to showing the last seven days of data, but will let you choose to see whatever period you wish. There's even a little checkbox that allows you to compare time periods.
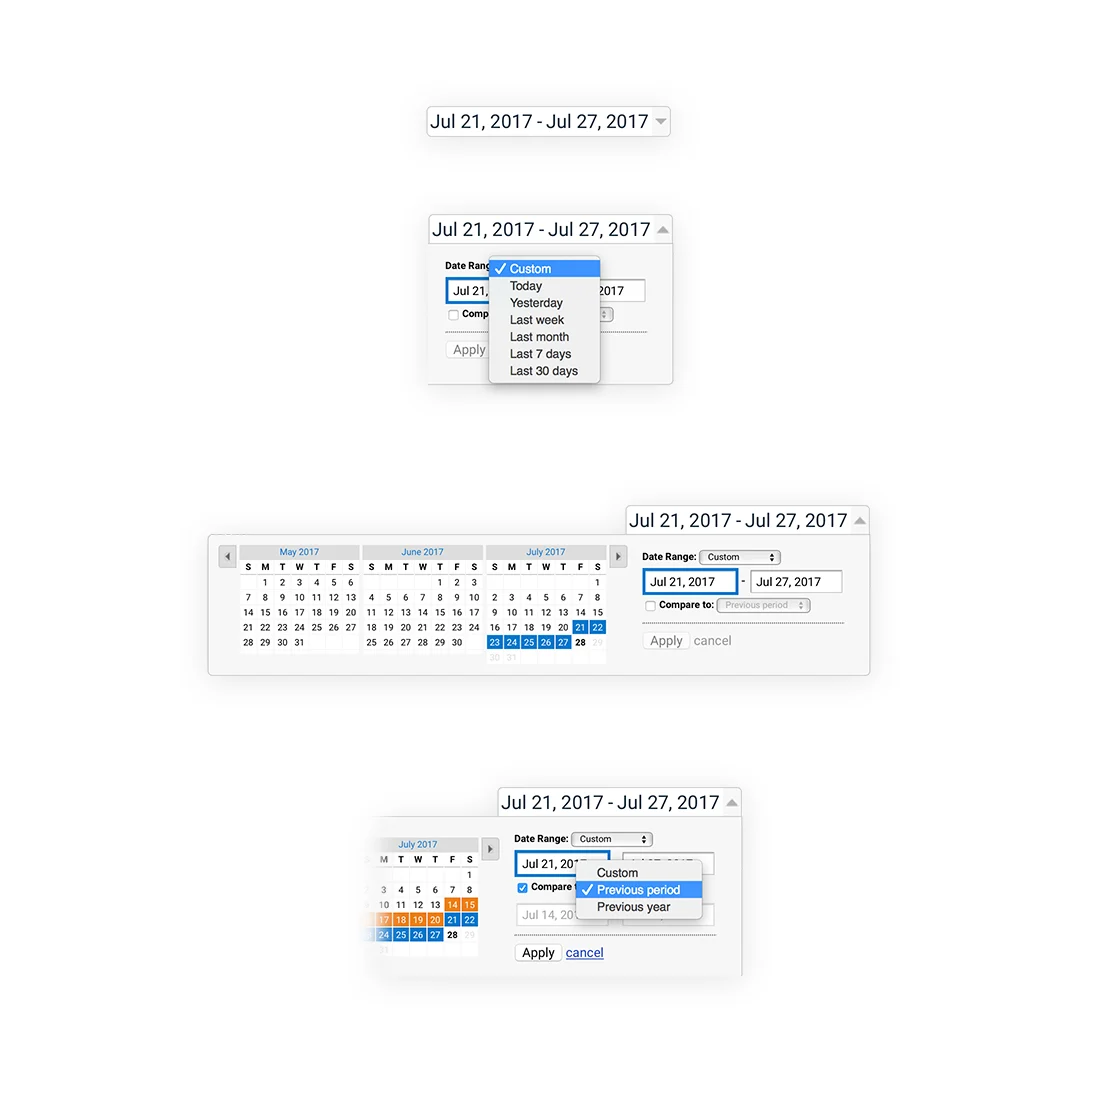
You can use this to compare numbers for multiple time periods in the tables. So, let's say you've been more active on Twitter in the last month. You can quickly compare your acquisition numbers to the previous month to see if it made a difference.
One more thing about time periods: this date choice usually sticks with you as you explore more analytics. Once you've picked a period to investigate, try looking at a lot of different pages here and see which metrics have changed. Even if it's just to satisfy your own curiosity, getting a grasp on your traffic will give you a clearer picture of the health of your brand.
More resources
Melissa Santos and Andy Newman contributed to this guide.
15 March 2018
Words by:Big Cartel
Tags
- Share